finding the data
over the weekend, i spent some time (and a bunch of codex credits) running ML experiments on a dataset from merlin monzel and colleagues about aphantasia, my research niche. this eLife paper from 2024 looks at the relationship between hippocampal-occipital connectivity and autobiographical memory deficits in aphantasics and controls. their findings show, in essence, two things about aphantasia:
- aphantasics recalling autobiographical memories were less confident and recalled fewer internal and emotional details
- aphantasics showed less hippocampal activation, but more visual cortex activation during memory retrieval this is interesting because of the relationship between the visual cortex and the lack of detail in memory recall; the underlying cause hasn’t been pinned down quite yet, but i like the explanation that the more excitable visual cortex adds noise to the signal, like trying to draw on an already dusty chalkboard.
in addition to the previously stated findings, it was also determined that controls showed strong negative functional connectivity between the hippocampus and the visual cortex during the task, and resting-state connectivity predicted visualization skill across both groups.
these conclusions were determined after collecting autobiographical interviews as well as fMRI data from a sample of 30 individuals. this small sample size seemed like a perfect application of prior lab’s TabPFN model, which i will get into in a moment. the data from these 30 individuals are publicly available, and contain six spreadsheets, documenting
- demographics
- autobiographical interview scores
- fMRI task behaviors
- BOLD signal intensities
- peak activation values
- functional connectivity measures providing a wealth of information to work with–especially using leave-one-out cross-validation (LOO-CV)–using various models.
tabpfn
this is a transformer model from prior labs that is exciting because it deals particularly with tabular datasets. if you’ve ever looked at an excel spreadsheet, you’ve seen a tabular representation of data. and most models/approaches have a hard time with predicting the next token of a dataset structured this way. tabpfn, trained on millions of synthetic tabular datasets, is engineered precisely for a small-sample-size, heterogenous-feature-type dataset like this aphantasia study, making it an excellent playground to understand both.
what i found
- autobiographical memory (AM) interview features classify aphantasic vs control participants extremely well in this dataset
- hippocampal-occipital functional connectivity is informative for group discrimination, but clearly weaker than the AM interview
- adding more neural features doesn’t help (and in most cases adds more noise)
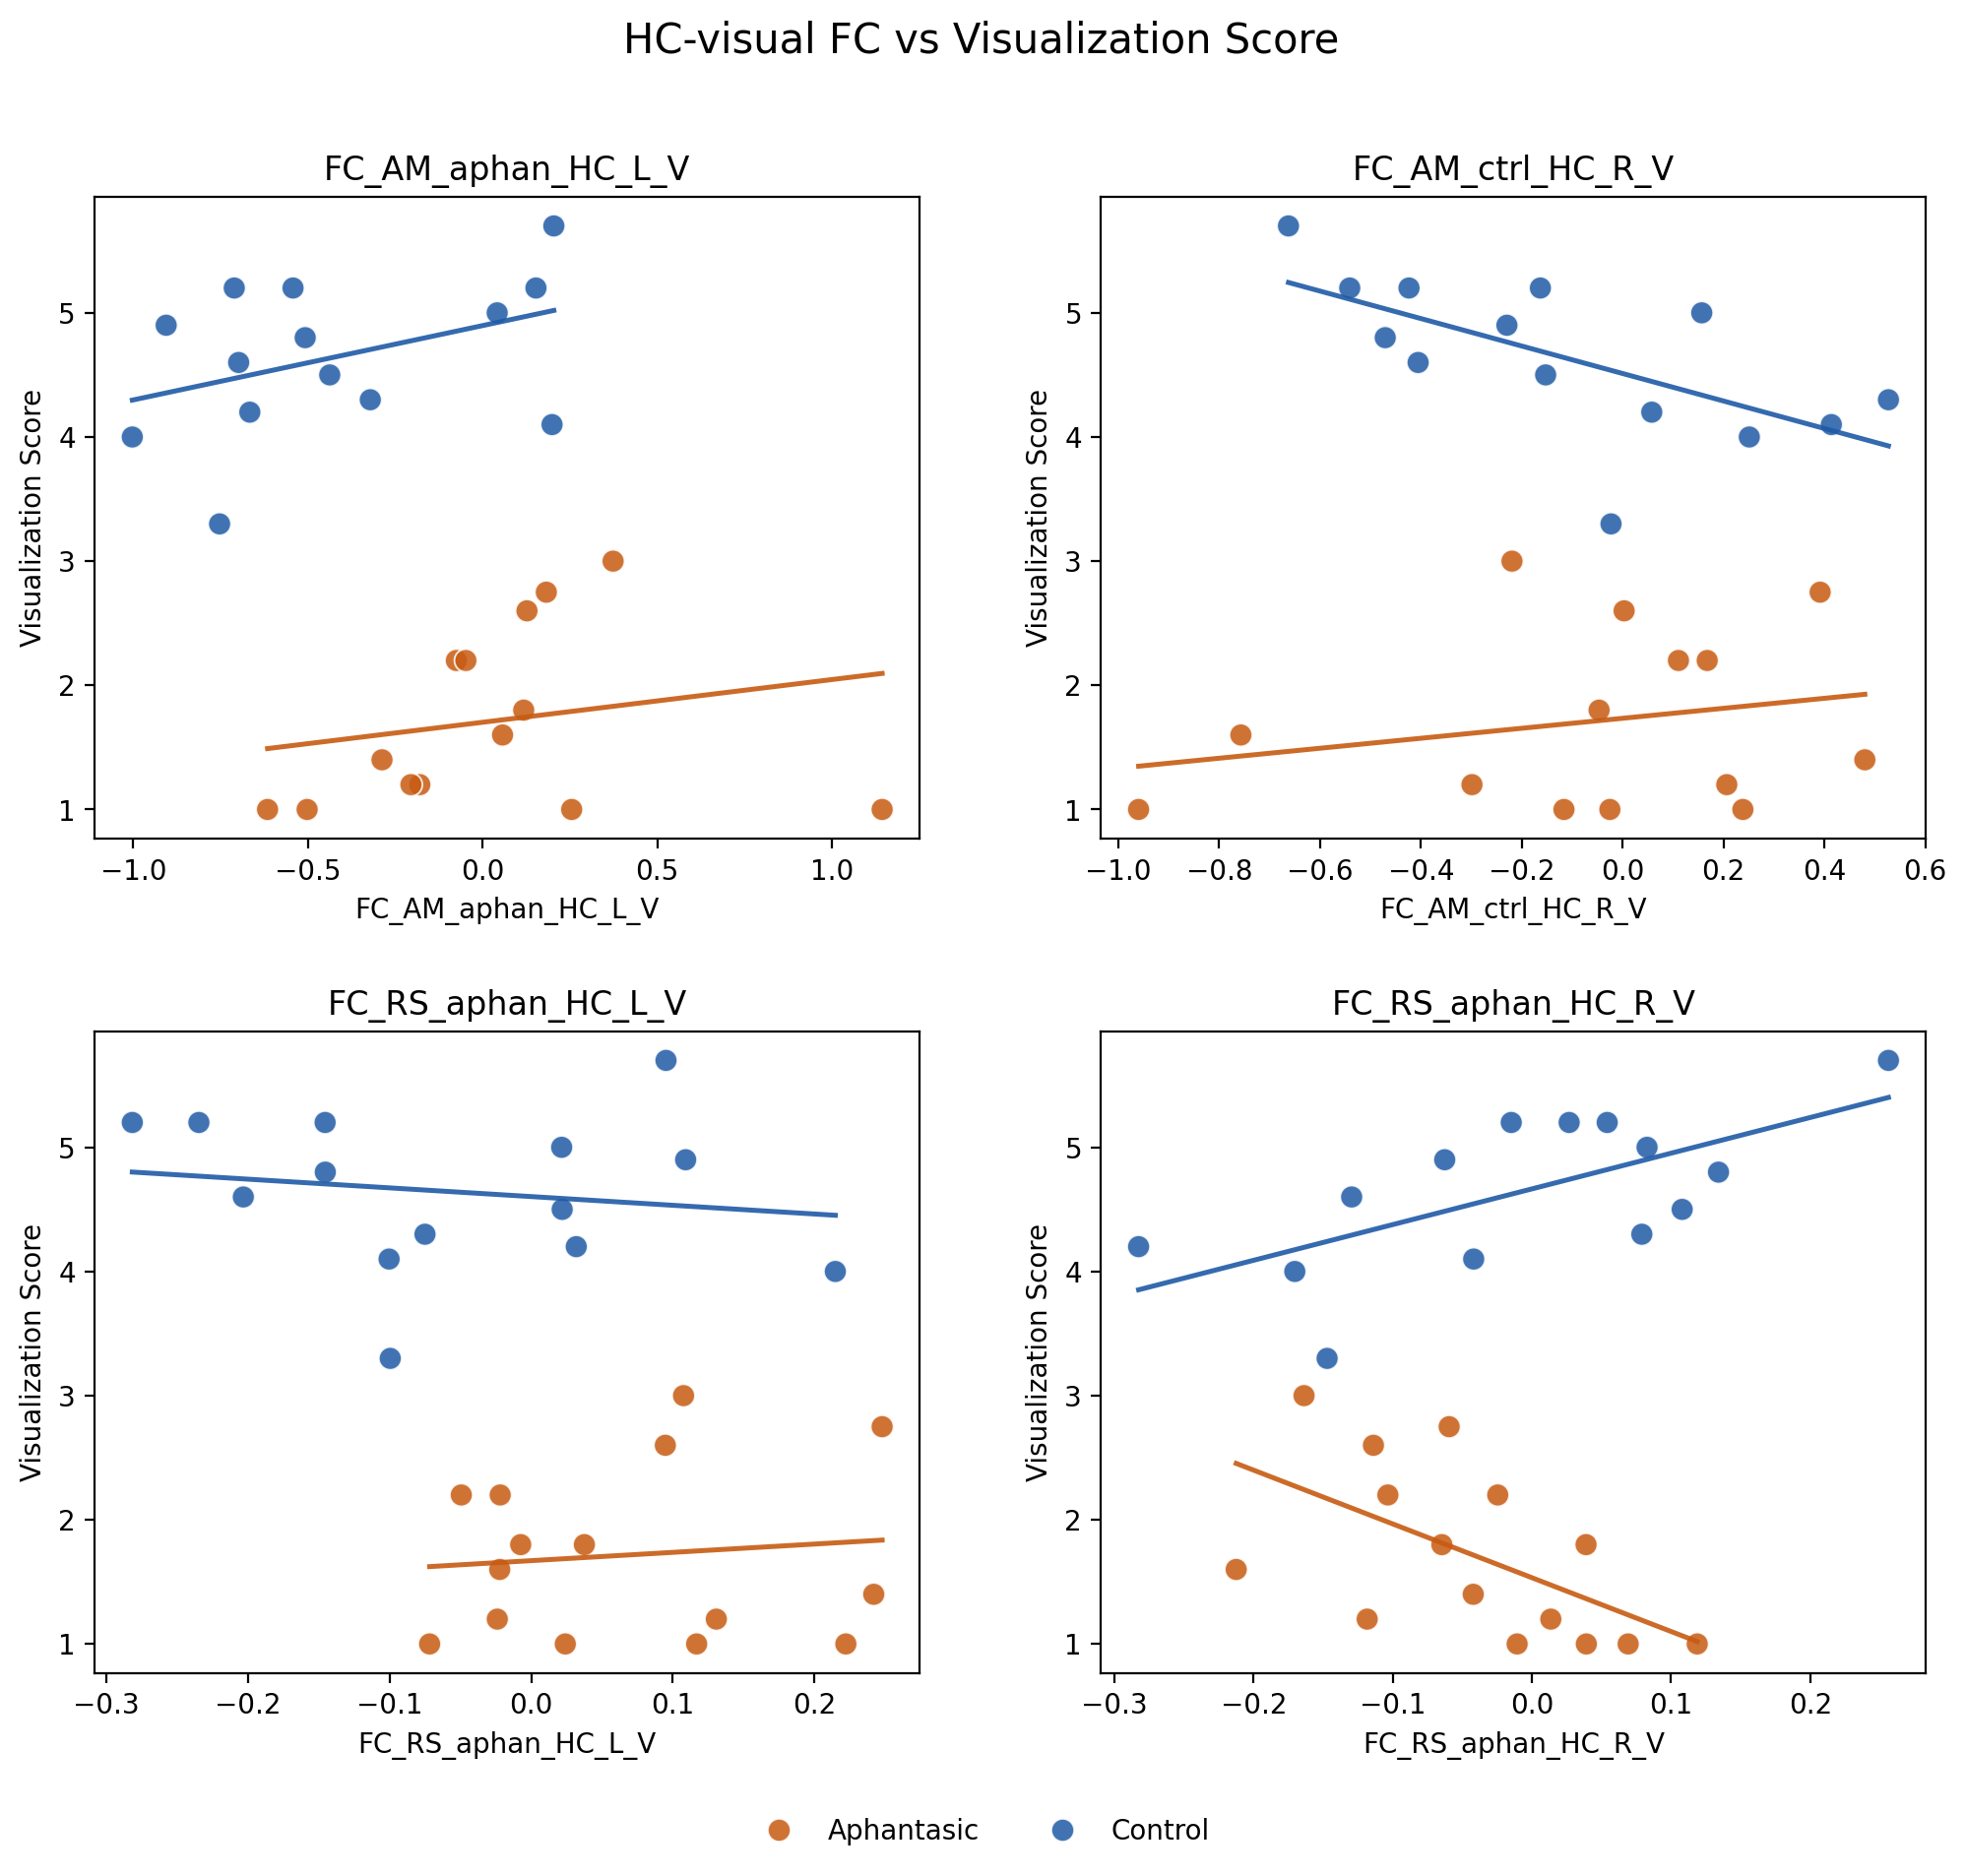
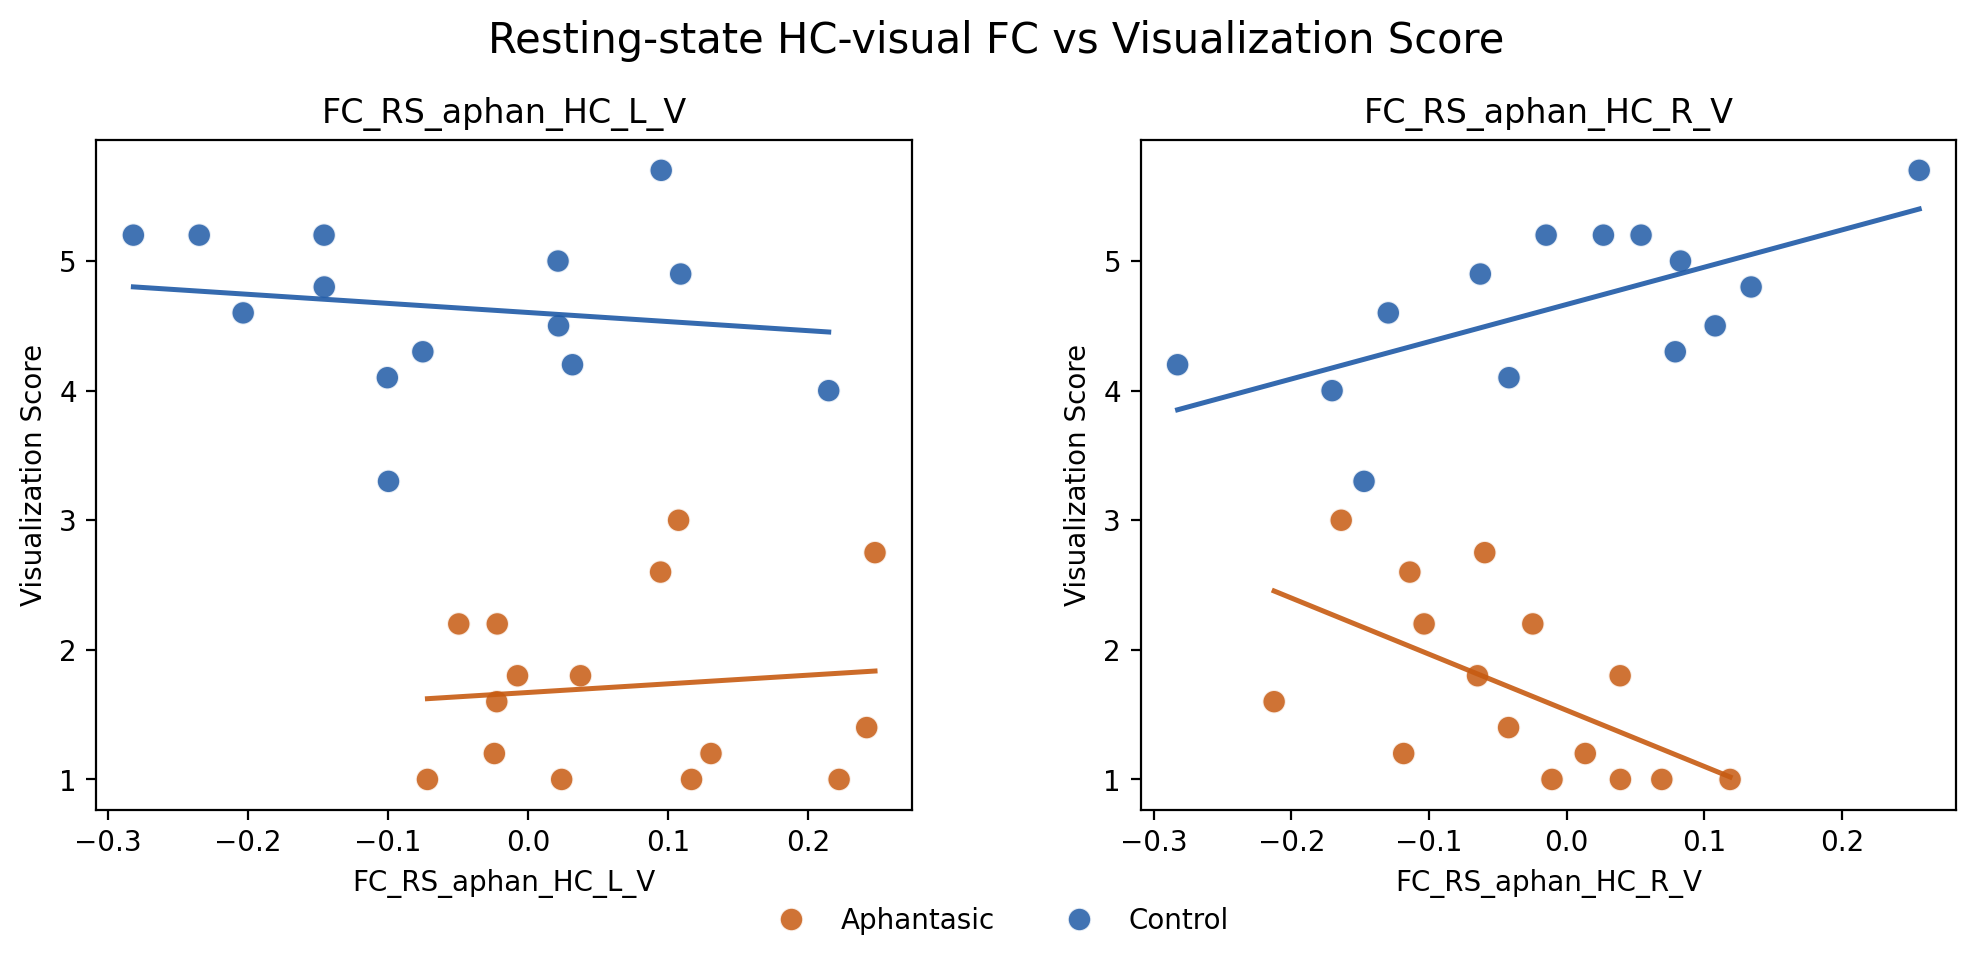
- resting-state right hippocampal-occipital connectivity correlates with visualization score at r=+0.65 in controls and r=-0.57 in aphantasics–significant at p<0.05.
these findings serve more as intuition-tuning, prior-updating effects, not a confirmed effect. this definitely needs replicating, and on a bigger sample size. i think it’s interesting to see the right hemisphere hippocampal-occipital coupling specifically, it’s consistent with the right-lateralized nature of visual imagery. seeing a negative correlation in aphantasics might suggest functional reorganization over a lifetime of lacking mental imagery.
the actual numbers
for the core behavioral classification story, the autobiographical memory interview features are the real signal:
am_behavioral_remote + xgboost: balanced accuracy0.9643, ROC AUC0.9571, accuracy0.9655am_behavioral_mean + xgboost: balanced accuracy0.9643, ROC AUC0.9476, accuracy0.9655
for hippocampal-occipital functional connectivity alone, using the focused 4-feature hippocampal-occipital FC block:
- best model:
random_forest - accuracy
0.8387 - balanced accuracy
0.8375 - ROC AUC
0.8333
if you isolate resting-state hippocampal-occipital connectivity even further, the result gets weaker, which matters for the stronger mechanistic claim:
- best resting-state-only model:
random_forest - accuracy
0.7419 - balanced accuracy
0.7438 - ROC AUC
0.7167
for continuous prediction, FC-only is basically null. that is the cleanest argument against treating hippocampal-occipital connectivity as a severity predictor.
for the 4-feature hippocampal-occipital FC set:
Epi_Richness: bestR² = 0.0265(ridge_regression)Visualization Score: bestR² = 0.0461(xgboost)
for the 2-feature resting-state hippocampal-occipital FC set:
Epi_Richness: bestR² = 0.0310(random_forest)Visualization Score: bestR² = 0.1211(random_forest)
once group membership is included, FC still doesn’t add useful explanatory value.
for the 4-feature hippocampal-occipital FC set:
Epi_Richness: group-only LOOR² = 0.6133, group+fcR² = 0.4948, nested-modelp = 0.7877Visualization Score: group-only LOOR² = 0.8101, group+fcR² = 0.7529, nested-modelp = 0.5495
for resting-state only:
Epi_Richness: group-only LOOR² = 0.6256, group+rs fcR² = 0.5850, nested-modelp = 0.4387Visualization Score: group-only LOOR² = 0.8157, group+rs fcR² = 0.7850, nested-modelp = 0.8161
so the clean read is that hippocampal-occipital connectivity carries group information, but not much continuous information about how impaired memory or visualization are once you already know which group someone belongs to.
where tabpfn was interesting
because this whole project started as a curiosity about tabpfn, i don’t want to bury those results either.
on classification:
am_behavioral_mean + tabpfn: balanced accuracy0.9310, ROC AUC0.9762, accuracy0.9310- 4-feature hippocampal-occipital FC +
tabpfn: accuracy0.7419, balanced accuracy0.7438, ROC AUC0.7625 - 2-feature resting-state hippocampal-occipital FC +
tabpfn: accuracy0.5806, balanced accuracy0.5792, ROC AUC0.6375
on regression:
am_behavioral_mean + tabpfnforEpi_Richness:R² = 0.9996, which is fascinating but honestly too good to lead with onn=29am_behavioral_remote + tabpfnforEpi_Richness:R² = 0.9896am_behavioral_mean + tabpfnforVisualization Score:R² = 0.6685- 4-feature hippocampal-occipital FC +
tabpfn:Epi_Richness R² = 0.0118,Visualization Score R² = -0.0678 - 2-feature resting-state hippocampal-occipital FC +
tabpfn:Epi_Richness R² = 0.0143,Visualization Score R² = 0.0283
in other words: tabpfn was great for exploring the dataset, and in some of the behavioral settings it was extremely strong, but it did not rescue the FC story. the connectivity result still looks like a group marker much more than a severity predictor.
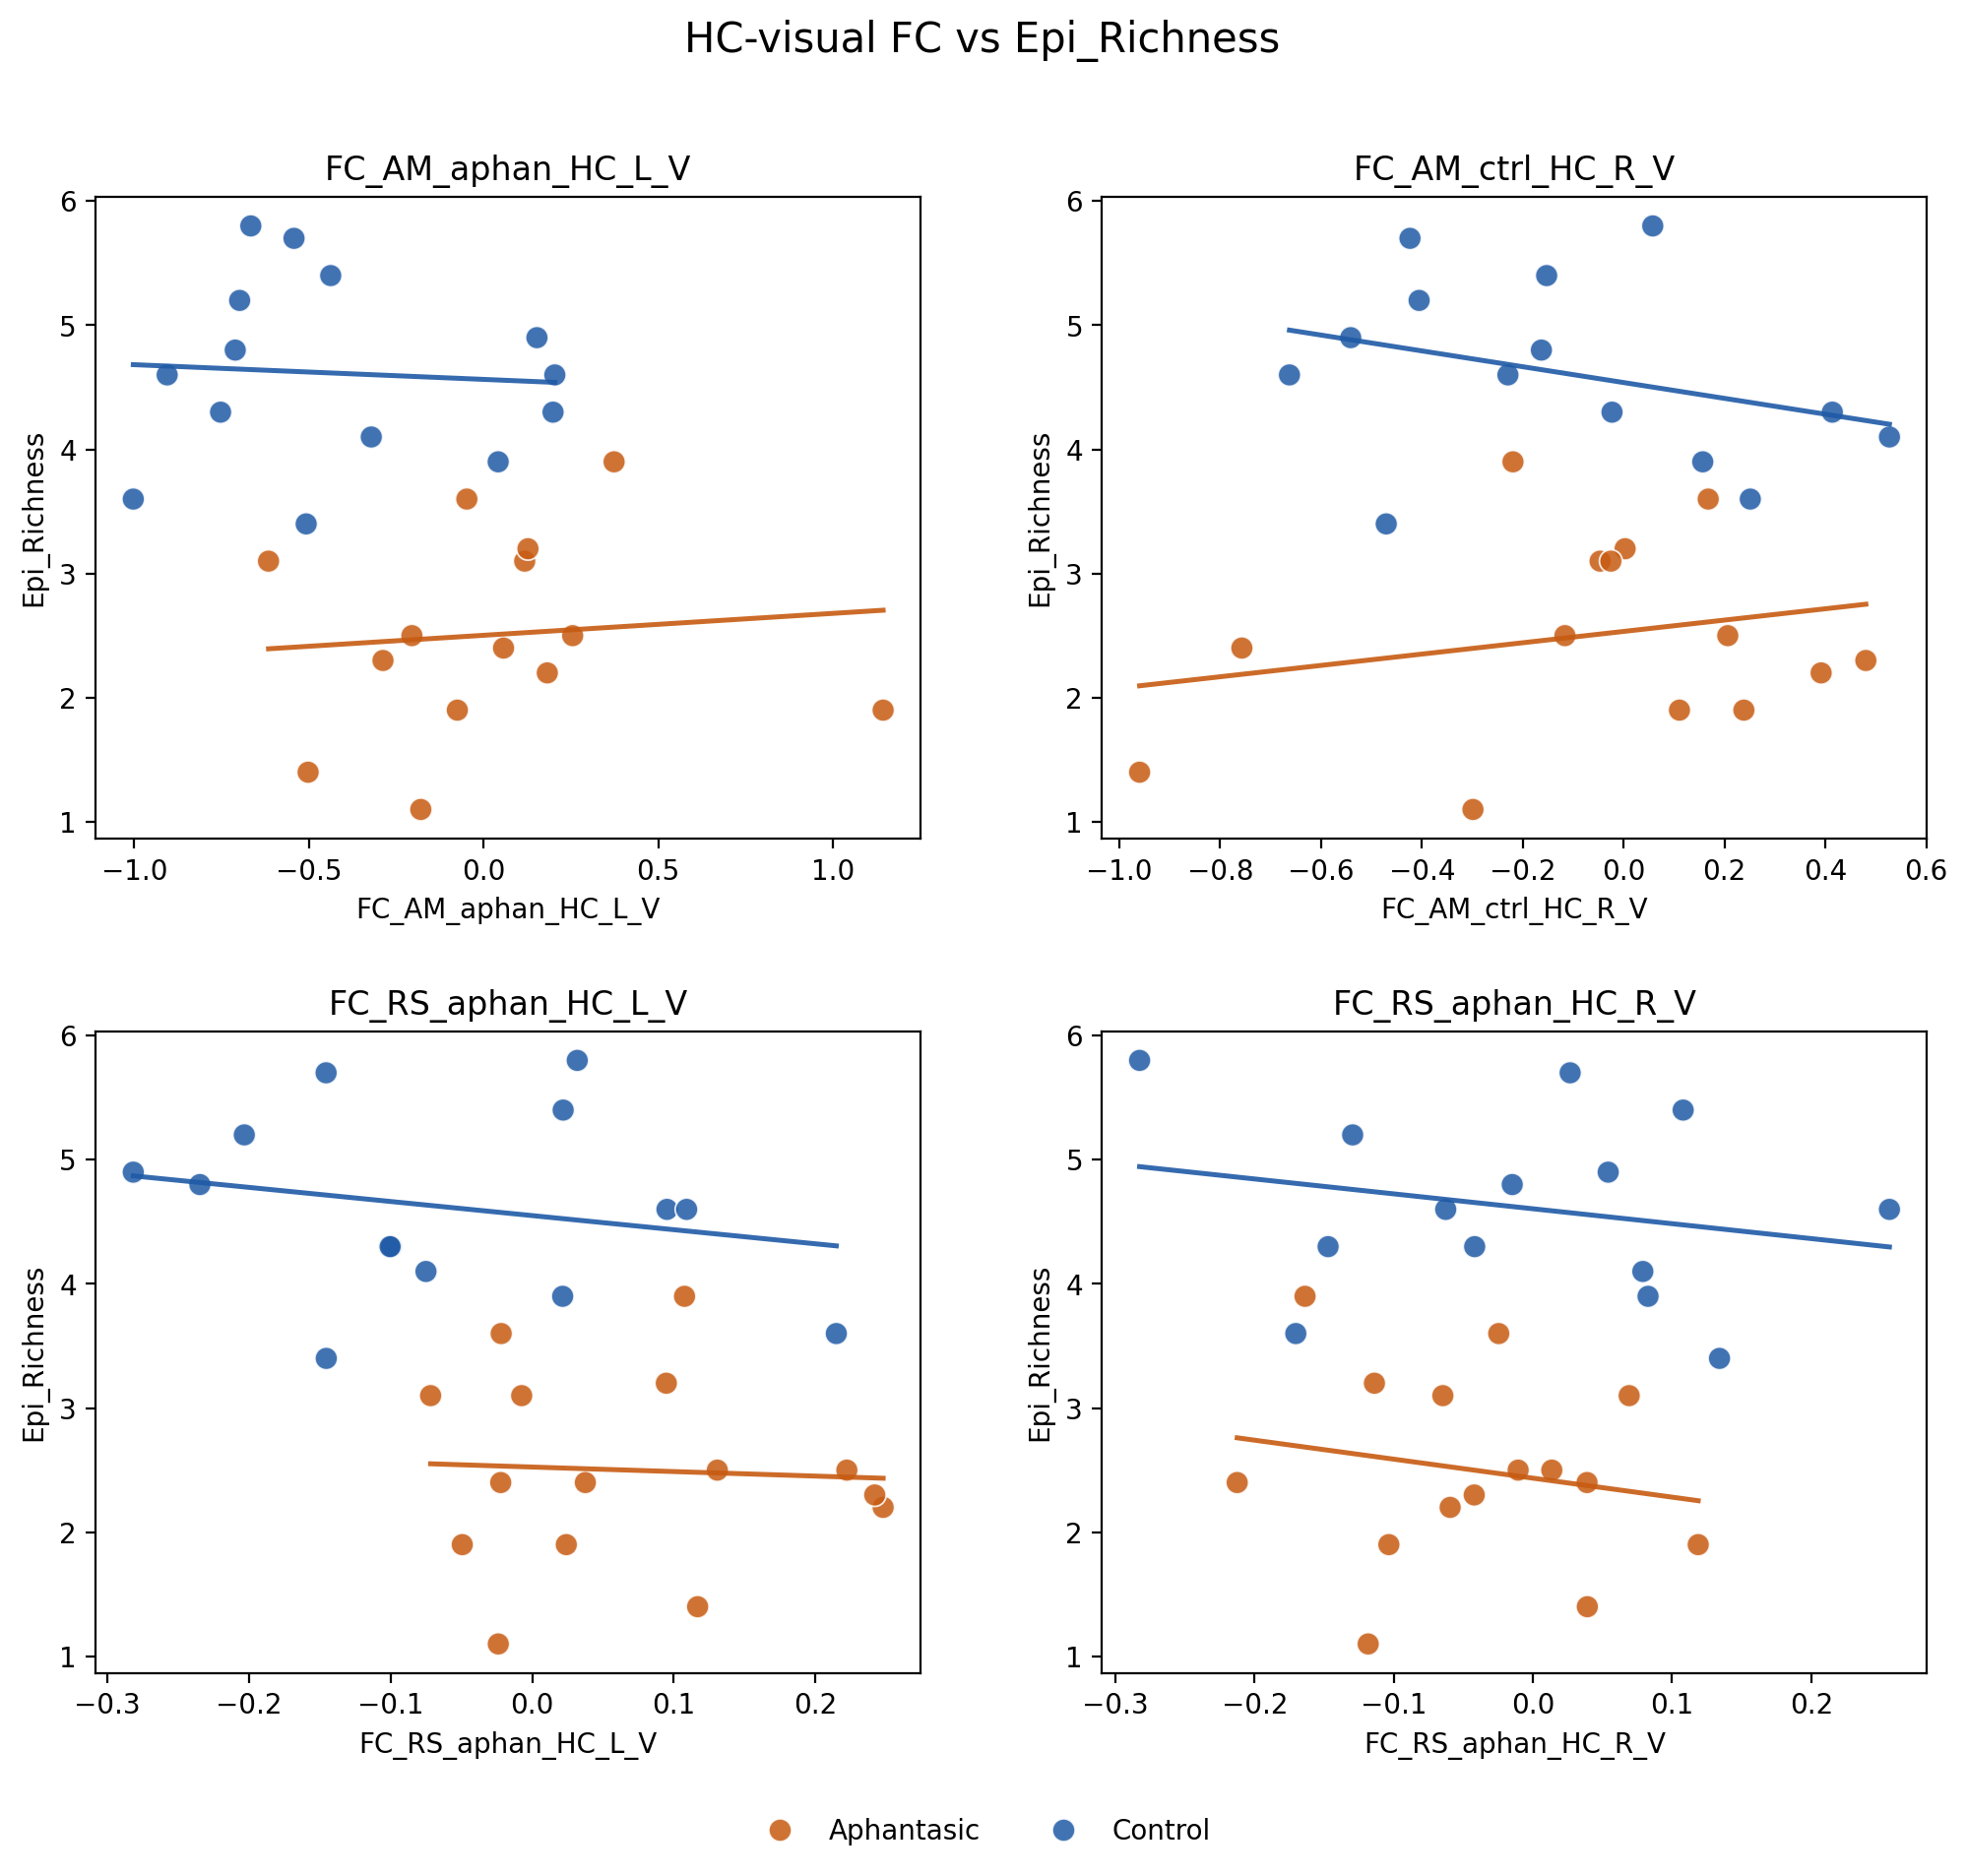
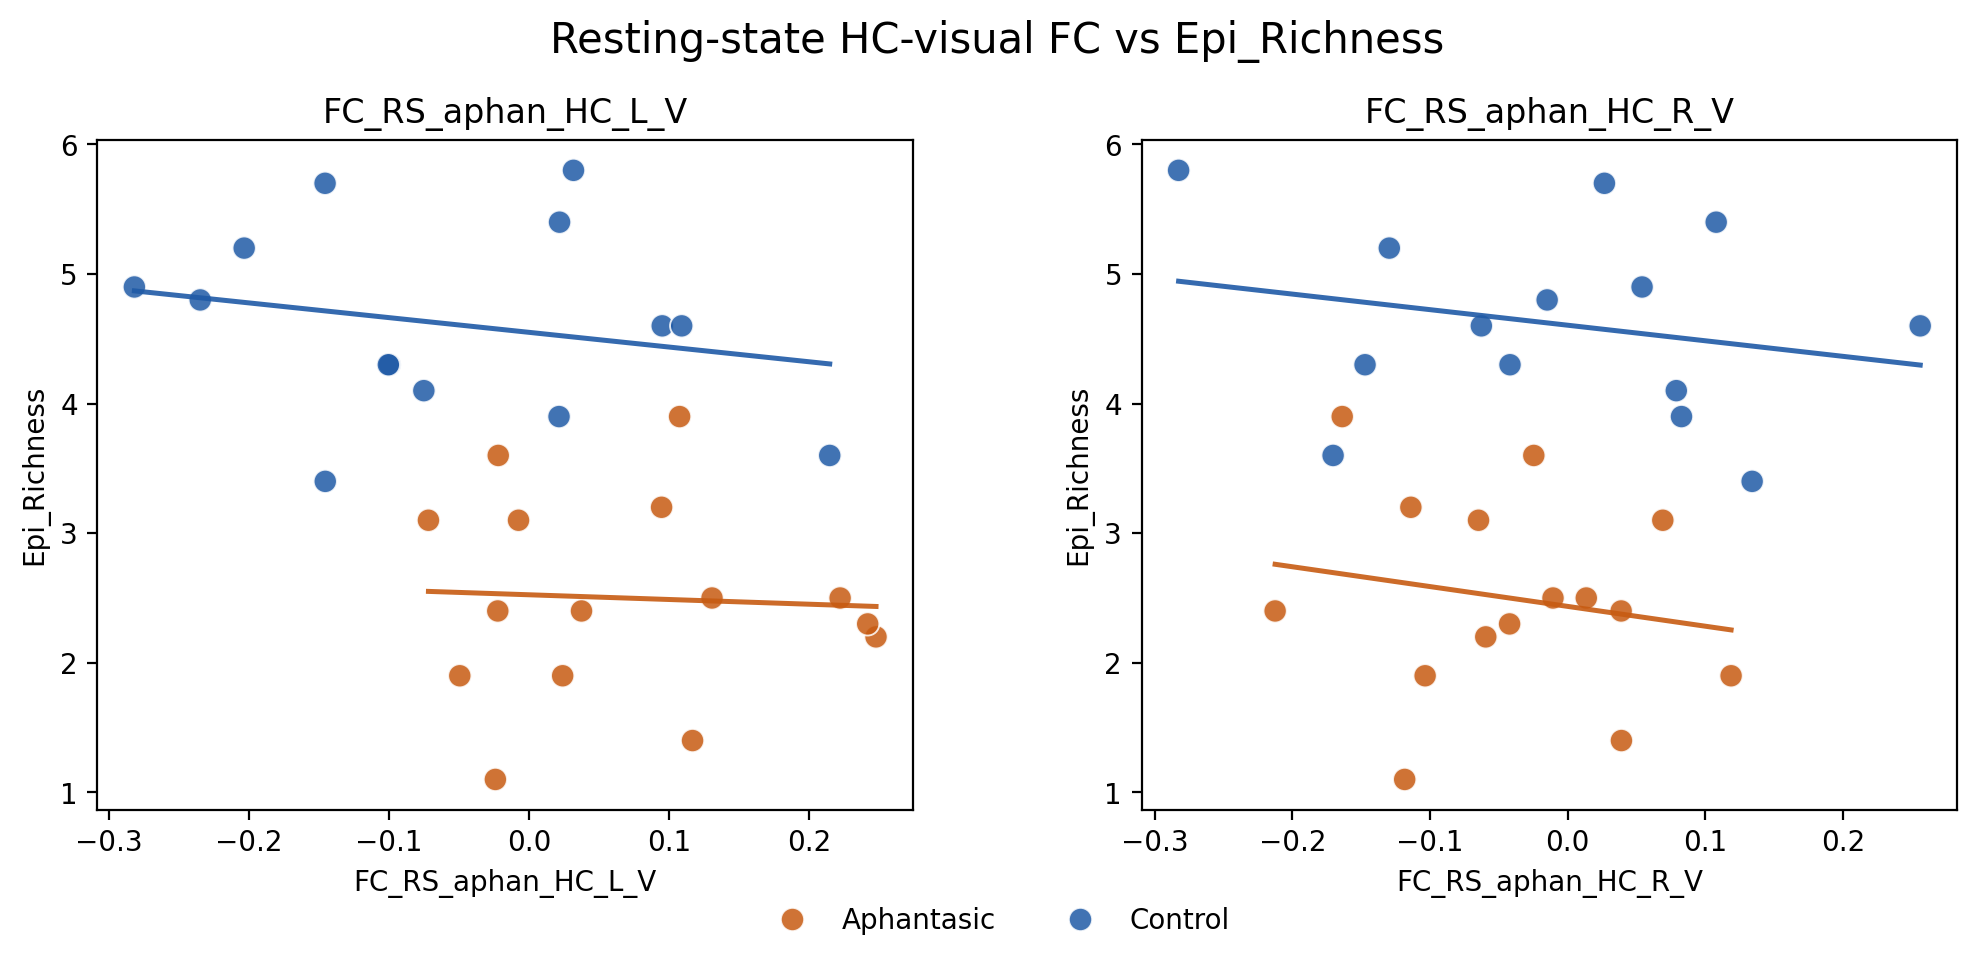
plots
the scatterplots are useful because they make the structure of the FC result much easier to see:
glossary
- aphantasia: the inability to form mental images (and can include other senses as well like smell or sound); individuals with aphantasia are called aphantasics
- hippocampal-occipital connectivity: a measure of how strongly the hippocampus (important for memory) and the occipital / visual cortex (important for vision and visual imagery) fluctuate together. in this context, it’s being used as a candidate neural signature of imagery-related memory differences.
- functional connectivity: a statistical relationship between brain regions, usually measured as correlated activity over time. this does not necessarily mean one region is directly causing the other to fire; it just means their signals move together in some reliable way.
- resting-state connectivity: functional connectivity measured when someone is not doing an explicit task in the scanner. the idea is to capture something more trait-like about the brain’s baseline organization.
- task-based connectivity: connectivity measured while someone is actively doing a task, in this case autobiographical memory retrieval. this can reflect how brain regions coordinate in the moment when a cognitive process is happening.
- BOLD signal: short for blood-oxygen-level-dependent signal. this is the indirect fMRI signal researchers use as a proxy for neural activity; it reflects local changes in blood oxygenation rather than neurons being measured directly.
- visualization score: a measure of how vividly or strongly someone reports mentally visualizing a remembered event.
- leave-one-out cross-validation (LOO-CV): a validation scheme for tiny datasets where the model trains on all but one participant, tests on the held-out participant, and repeats this until everyone has served as the test case once.
- ROC AUC: area under the receiver operating characteristic curve. for classification,
0.5is chance,1.0is perfect separation, and higher is better. - r²: a regression metric that asks how much variance in an outcome a model explains. values near
0mean the model explains basically nothing; negative values mean it predicts worse than just guessing the average every time.